Climate Change Visualization
This is a visualization of the impacts of Climate Change on our Planet's temperature between 1980 and 2022. It shows the monthly average temperature variation in relation to the 1951-1980 global average.
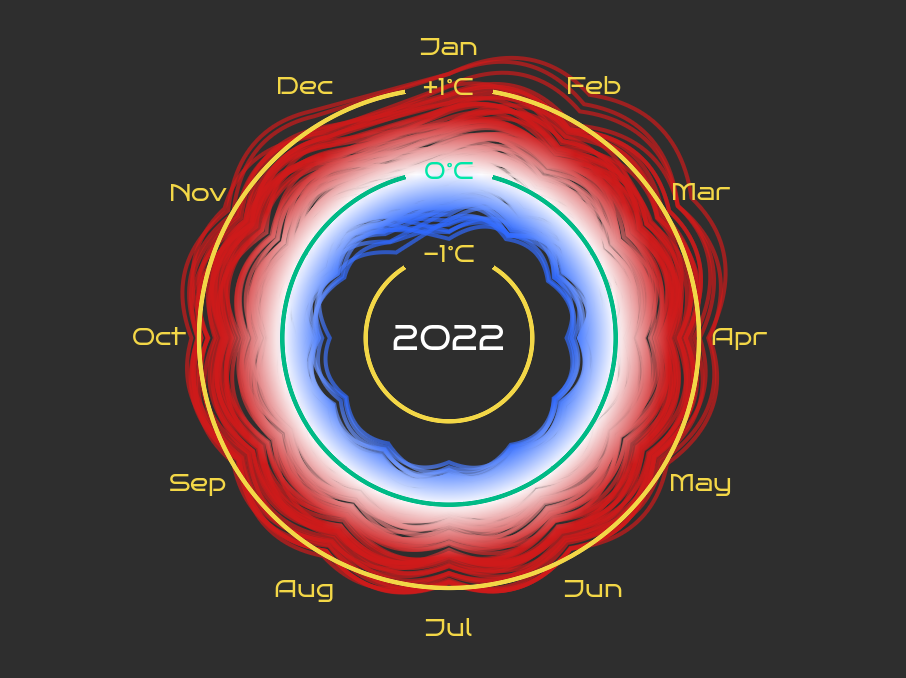
This is a visualization of the impacts of Climate Change on our Planet's temperature between 1980 and 2022. It shows the monthly average temperature variation in relation to the 1951-1980 global average.
Comments
Log in with itch.io to leave a comment.
Neat! These kind of graphs are always quite chilling and even more so when seen animated.